
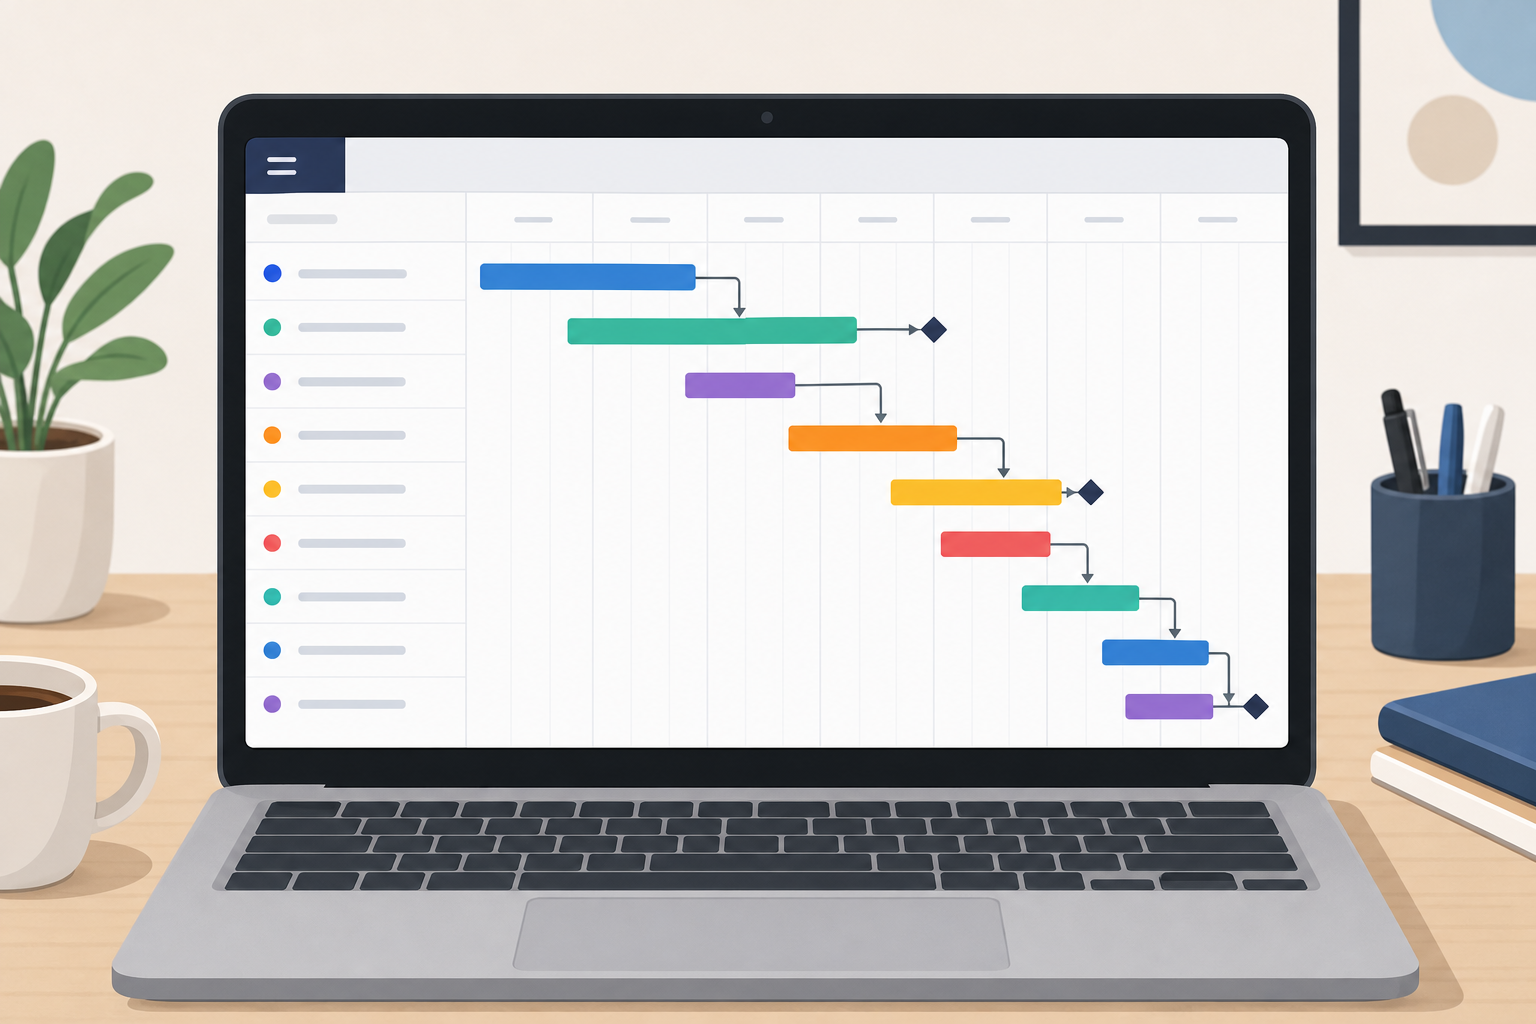
A gantt chart template is a pre-built timeline file—usually in a spreadsheet or a dedicated planning app—that lets you drop in your own tasks, dates, and owners instead of starting from a blank grid. For most small-to-mid-size projects, a good gantt chart template plus 20-30 minutes of setup gets you a working project timeline with dependencies and milestones already mapped out.
This guide walks through where to get one, how to customize it for your actual project, and how to handle the two features that trip people up most: task dependencies and milestones. We’ll also cover when a free template is enough and when it’s worth moving to dedicated software.
What Is a Gantt Chart Template?
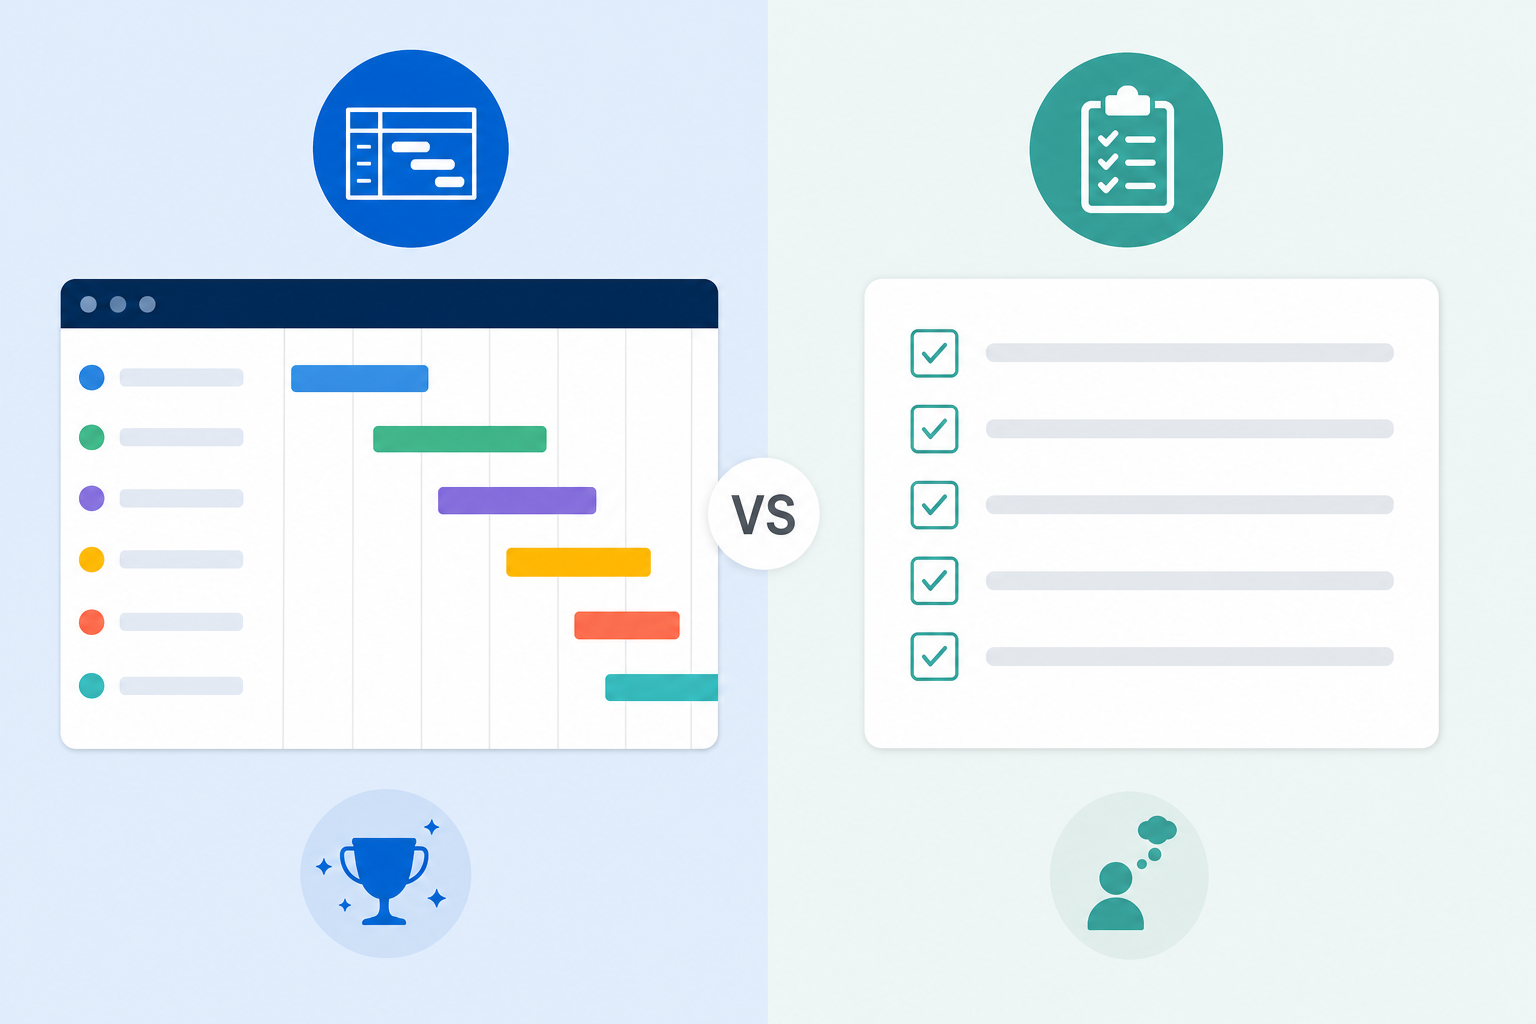
A gantt chart template is a horizontal bar-chart layout, pre-formatted with columns for tasks, start/end dates, duration, and owner, plus a timeline grid where bars represent how long each task runs. Instead of building the formulas and formatting from scratch, you fill in your project’s details and the bars populate automatically.
Most gantt chart templates fall into one of three categories:
- Spreadsheet templates — built in Excel or Google Sheets, using conditional formatting to draw the bars.
- Document-based templates — diagram files built in tools like Visio, useful when you need a more polished, presentation-ready layout.
- App-native templates — pre-built views inside project management software such as Microsoft Project, where dependencies and milestones are handled natively rather than with manual formulas.
For a lot of teams, a spreadsheet-based gantt chart template is genuinely enough. It’s free, familiar, and easy to share. The limitations show up once a project has heavy cross-task dependencies or more than a handful of contributors updating it at once — that’s usually the point where it’s worth looking at purpose-built software instead.
How to Download a Free Gantt Chart Template
Downloading a gantt chart template takes a few minutes: search for a reputable source, pick a format that matches the software you already use, and confirm it has dedicated columns for dependencies and milestones before committing to it.
A few things worth checking before you download:
- Does it open cleanly in the software you actually have (Excel, Google Sheets, or a specific app)?
- Does it already include a dependency column or arrows, or will you need to add that logic yourself?
- Is there a clear way to mark milestones separately from regular tasks (usually a diamond marker or a distinct row style)?
- Is the date range and timeframe easy to resize for your project’s length?
If you’re already working inside Microsoft’s ecosystem, Excel 2024 handles spreadsheet-based gantt chart templates well, including the conditional formatting most free templates rely on for the bar visuals. For projects that need a more visual, diagram-style layout rather than a spreadsheet grid, Visio Professional 2024 has native timeline and Gantt-style shapes that are easier to format for client-facing presentations.
Customizing Your Gantt Chart Template Step by Step
Customizing a gantt chart template comes down to three steps: list your tasks with realistic durations, link the tasks that depend on each other, and flag your milestones. Skipping any one of these turns the chart into a static picture instead of a working planning tool.
Step 1: Add Tasks and Durations
Start by listing every task in the order they’ll realistically happen, not necessarily the order you thought of them. For each task, fill in:
- A clear, specific task name (avoid vague labels like “Phase 1”)
- Start date and end date, or start date plus duration
- An owner — one person, not a team, so accountability is clear
Keep tasks broken down to roughly 1-2 week chunks where possible. Tasks longer than that tend to hide delays until it’s too late to course-correct.
Step 2: Build Task Dependencies
Dependencies are what separate a real project timeline from a simple list of dates. In most gantt chart templates, you’ll link dependencies one of two ways: typing the ID of the predecessor task into a “depends on” column, or drawing a connecting line in a diagram-based tool.
There are four standard dependency types worth knowing:
- Finish-to-Start — the most common: Task B can’t start until Task A finishes.
- Start-to-Start — Task B can start once Task A starts, without waiting for it to finish.
- Finish-to-Finish — Task B must finish at the same time as (or after) Task A.
- Start-to-Finish — rare, but used when Task B can’t finish until Task A begins.
If you’re mapping these manually in a spreadsheet, finish-to-start dependencies are the easiest to maintain and cover the vast majority of real-world cases. Apps built specifically for scheduling — including newer AI-assisted tools — can flag dependency conflicts automatically; we covered how that’s changing project scheduling in more detail in our look at AI-powered project scheduling.
Step 3: Mark Key Milestones
Milestones are zero-duration markers that flag a major checkpoint — a client sign-off, a launch date, a regulatory deadline — rather than a task with its own duration. In a gantt chart template, milestones are usually shown as a diamond shape instead of a bar, placed at a single date rather than spanning a range.
Good milestones to include on almost any project:
- Project kickoff and final delivery
- Any date a client or stakeholder needs to approve something
- Budget or resourcing checkpoints
- Regulatory or contractual deadlines
A useful rule: if missing a date would require renegotiating the whole timeline, it’s probably a milestone — not just another task.
Choosing the Right Gantt Chart Template for Your Project Size
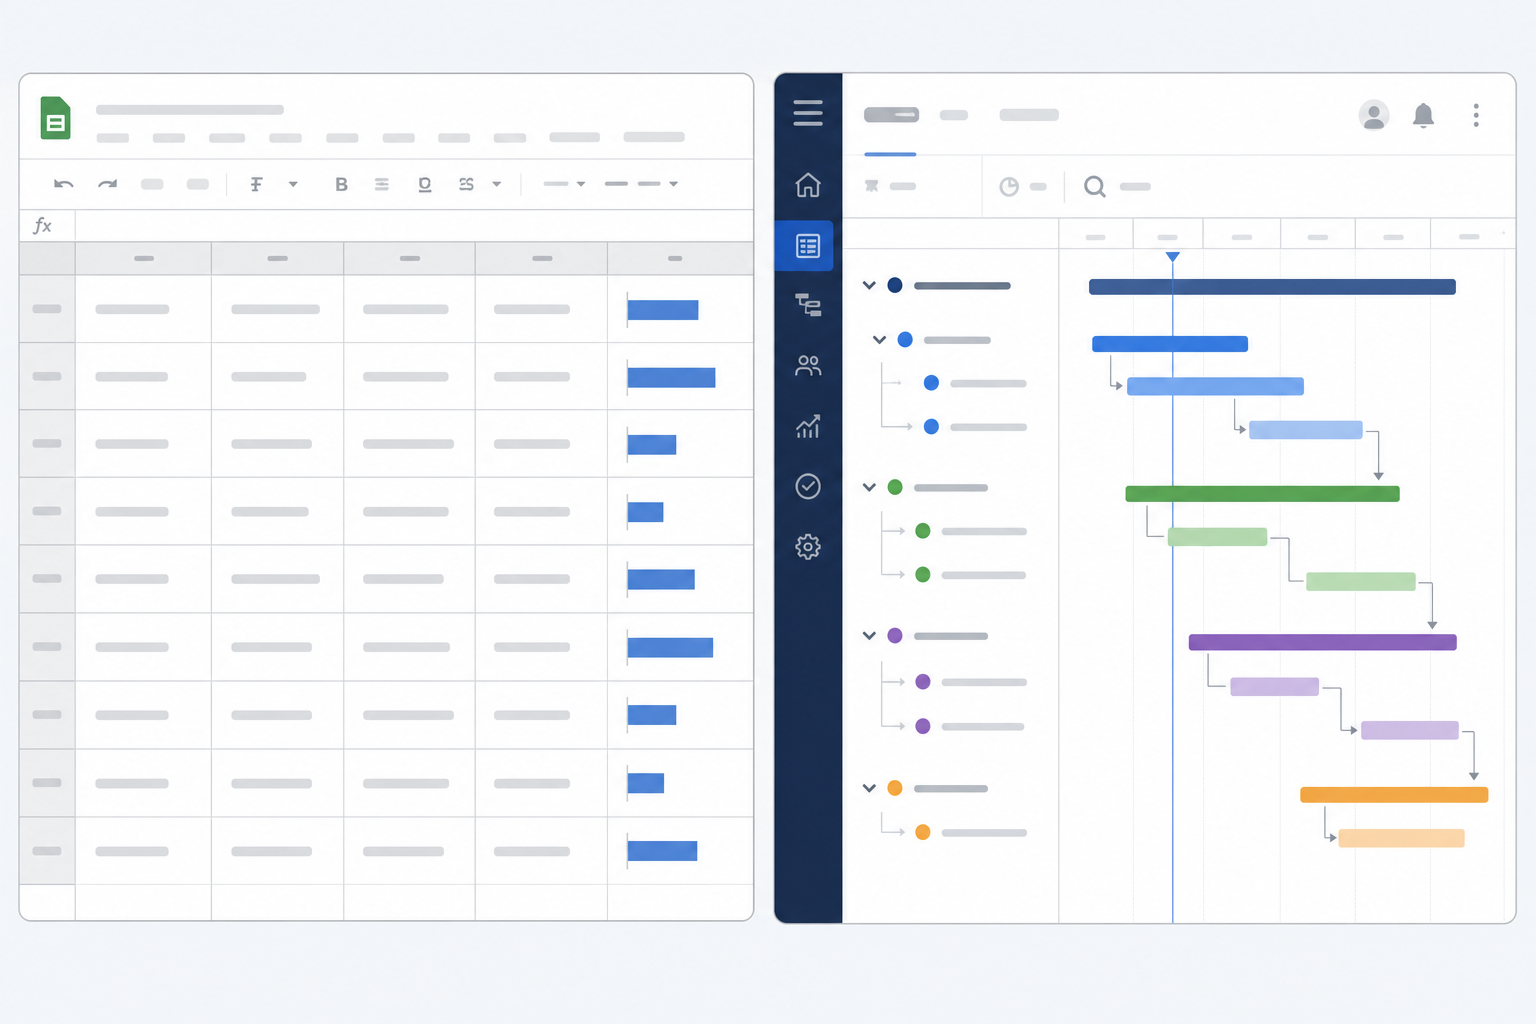
The right gantt chart template depends mostly on project length and team size: a single spreadsheet tab works well under roughly 50 tasks and a handful of contributors, while larger or more dependency-heavy projects benefit from dedicated scheduling software.
Spreadsheet Templates vs. Dedicated Software
A spreadsheet-based gantt chart template is the right call when:
- The project has a single owner updating the timeline
- There are fewer than roughly 50 tasks
- Dependencies are mostly simple finish-to-start relationships
Dedicated project management software makes more sense once multiple people need to update tasks simultaneously, dependencies get complex, or you need automatic rescheduling when a task slips.
When to Upgrade to Microsoft Project or Visio
Microsoft Project is built specifically around dependency logic, resource leveling, and automatic timeline recalculation — if one task slips, everything downstream shifts automatically instead of requiring a manual rebuild. Project Professional 2024 is available from Top Key Shop at €68.90, which is a realistic step up once a free gantt chart template starts feeling fragile under the number of tasks or dependencies you’re tracking.
If your priority is a polished, visual timeline for stakeholder presentations rather than active day-to-day scheduling, Visio Professional 2024 (from €42.90 at Top Key Shop) is often the better fit — it’s built for clean diagrams, not live task tracking.
Common Mistakes to Avoid With a Gantt Chart Template
The most common mistake with a gantt chart template is treating it as a one-time document instead of a living timeline that gets updated as the project actually progresses.
- Not updating it after kickoff. A gantt chart template is only useful if it reflects reality — update it weekly, not just at the start.
- Overcomplicating dependencies. Linking every task to every other task makes the chart unreadable. Only map dependencies that genuinely block progress.
- Skipping milestones entirely. Without milestones, it’s hard to tell at a glance whether a project is actually on track.
- Ignoring the critical path. The critical path is the sequence of dependent tasks that determines your earliest possible finish date — delays anywhere on it delay the whole project.
- Using the wrong tool for team size. A spreadsheet that worked for a 3-person project will struggle at 15 people updating it concurrently.
According to Asana’s guide to Gantt chart basics, the core value of a Gantt chart is giving teams a single visual reference for tasks, owners, and dependencies — which is exactly what breaks down when a template isn’t kept current.
FAQ
What should a gantt chart template include?
At minimum, a gantt chart template needs task names, start and end dates, an owner column, a visual timeline grid, a way to show dependencies, and a distinct marker style for milestones. Templates without a clear dependency or milestone format usually need manual workarounds.
How do I add dependencies to a gantt chart template?
In spreadsheet templates, add a “depends on” column referencing the predecessor task’s row or ID, then use conditional formatting or a formula to shift the dependent task’s start date automatically. In diagram or app-based tools, you typically draw or select a connecting link between the two tasks directly.
What’s the difference between a gantt chart and a milestone chart?
A gantt chart shows tasks as bars spanning a date range, including their duration and dependencies. A milestone chart only shows single-point dates — no duration, no task bars — and is used when the focus is purely on key deadlines rather than the work in between.
Can I build a gantt chart template in Excel?
Yes — Excel is one of the most common tools for building a gantt chart template, using a stacked bar chart or conditional formatting to simulate the bars against a date-based grid. It handles small-to-mid-size projects well, though very large or multi-user projects tend to outgrow a single spreadsheet.
When should I upgrade from a free template to Microsoft Project?
It’s usually time to upgrade once your project has more dependencies than you can track reliably by hand, multiple people need to update the schedule at once, or you need automatic rescheduling when tasks slip. Microsoft Project handles all three natively, where spreadsheet templates require manual maintenance.
